While talking about state of infrastructure in our cities one thing we must keep in mind the how rain is actually different in different places
For example here is a data of Avg Annual Rain in different Mega cities around the world (ChatGPT Used) :-
| City | Average Annual Rainfall (mm) |
|---|
| London | 600–700 mm |
| Singapore | 2,300–2,700 mm |
| Tokyo | 1,400–1,600 mm |
| Washington D.C. | 1,000–1,200 mm |
| São Paulo | 1,300–1,600 mm |
| Mumbai | 2,200–2,500 mm |
| Kolkata | 1,600–1,800 mm |
And here is how intense they can be from their peak months :-
| City | Wettest Month | Rainfall in Wettest Month (mm) |
|---|
| London | October–November | ~60–70 mm |
| Singapore | November–December | ~300–400 mm |
| Tokyo | September | ~200–250 mm |
| Washington D.C. | July | ~100–120 mm |
| São Paulo | January | ~250–300 mm |
| Mumbai | July | ~900–1,000 mm |
| Kolkata | July | ~400–450 mm |
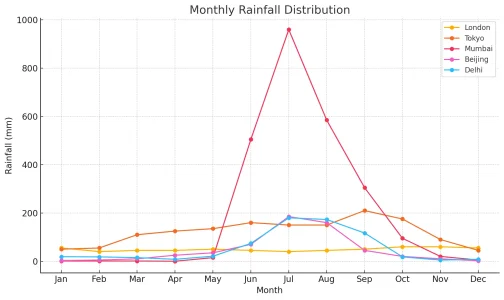
Mumbai and Kolkata both being in tropical and being hit by Indian monsoon creates unique situation where they receive a lot of rain in very short time , here is graph of monthly distribution :-
View attachment 43401
Look how mumbao shots up in monsoon season, this add a lot of pressure on water infra that is not seen around the world for a city this large.


