You are using an out of date browser. It may not display this or other websites correctly.
You should upgrade or use an alternative browser.
You should upgrade or use an alternative browser.
Chinese Economy Watch (7 Viewers)
- Thread starter rockdog
- Start date
More options
Who Replied?- Joined
- Jul 3, 2024
- Messages
- 1,718
- Likes
- 2,293
i suggest you check yourself, you do attack in many ways but i have forgiven you simply because childish attitudes are to be ignored, do not play the racial card here better improve your respect for others and commit to use arguments and sources properly1. It's complicated, there are Hanuman and also Wuzhiqi

Wuzhiqi - Wikipedia
en.wikipedia.org
Wukong might be a mixed with both, in China southern there were monkey worship for 3000 yrs. But this book is very "late", just 600-800 yrs ago got written.
2. culture communication is always bi-direction, without Tang Sanzang (the only real person in the book of Jornery to the west) (Xuang Zang)'s book:

Records of the Western Regions - Wikipedia
en.wikipedia.org
Even modern Indian didn't know how good was ancient Indian culture was, it's all destroyed by muslim i feel sad.

Which foreign books have a description about Nalanda University?
Answer: Nalanda as a monastic institution in the time of Buddha emerged into the greatest academic and spiritual centre of Asia in the early medieval times. This alludes to successive stages of development in Buddhism from naive realism of the early monastic order to developed metaphysics of the ...www.quora.com
It's always good to communicate about culture with you @srev2004 , if you like the game i will be happy about it.
But racial attack like this, i will report
View attachment 7815
@haldilal racial attack.
View: https://www.youtube.com/watch?v=kFl4YdvDE_8
Indian GDP was > Chinese GDP from 1-1700 AD. Why do you think History won't repeat itself?
good, Indian culture on tiktok, nice combination.
I think you misunderstood me. This is a Chinese women in Chinese culture praising India as center of heaven. TikTok is banned in India, remember.good, Indian culture on tiktok, nice combination
- Joined
- Jul 3, 2024
- Messages
- 1,718
- Likes
- 2,293
uhm mister propaganda claims BYD to be outselling every one in Mexico let us see prices to see if Mister propaganda is rightI don't think India has better internet penetration rate than Chin, even population is slightly larger.
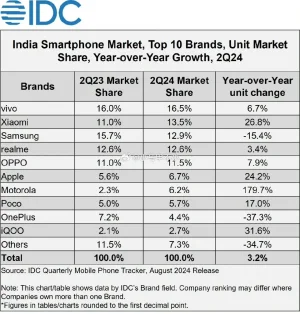
But it's anyway good market for mobiles. 80% share by Chinese brands.
View attachment 7818
In Mexico, the majority of the top 10 best-selling models are sedans. Compared to last year, some positions in this ranking have changed. Of the 10 cars on this list, six are domestically produced and the other four are imported from Asia.
1. Nissan Versa
The Nissan Versa takes first place, with 44,418 units sold from January to June of this year. This model is produced at Nissan's assembly plant in Aguascalientes, where the Kicks and March models are also manufactured.

Los autos más vendidos en México en 2024: solo uno es de marca china
Nissan lidera el ranking con cuatro modelos en el top 10. Le sigue Mazda con dos vehículos, mientras que Chevrolet, KIA, Volkswagen y MG Motor cuentan con una unidad cada una en el listado.
Version
Price
Sense TM '24 $ 309,900
Sense CVT '24
$ 326,900
Advance MT '24 $ 347,900
Advance CVT '24 $ 367,900
SR CVT '24 $ 384,900
Exclusive CVT '24 $ 400,900

Nissan Versa 2025 - Precios especiales | Nissan México
Obtén el mejor precio de Nissan Versa 2024. ¡Aprovecha nuestros precios especiales y lleva a casa tu auto ideal hoy mismo!
Now BYD prices in Mexico
Dophiin
Youthful, free, energetic
Purchase price from:
$535,990.00*
100% electric hatchback.
Purchase price from:
Dolphin Mini Plus: $398,800.00*
*Price includes VAT.
HAN EV
An electric sports car with exceptional performance
Purchase price from:
$1,369,000.00*
King
Plug-in hybrid sedan
Purchase price from:
$499,800.00*
Seal
100% dynamic and intelligent electric sedan
Purchase price from: 778800.00
Shark
Purchase price from:
GL version: $899,980.00*
*Price includes VAT
Song plus
Purchase price from:
$778,800.00*
*Price includes VAT
Tang EV
Purchase price from:
$1,399,000.00*
*Price includes VAT
Yuan Plus
Purchase price from:
$799,000.00*
*Price includes VAT
BYD Dolphin 2024 | Autos Liverpool
Descubre la evolución en movilidad con el modelo Dolphin 2024 de BYD, el compacto que redefine la movilidad sostenible. Agenda tu prueba de manejo.
To believe BYD sells more than MG- you need to see prices too but at those prices it is hard to believe you can compete with the japanese brands
MG Models and Prices
Available Models Used Car Prices
HS Price from $392,332
MG5 Price from $275,999
RX8 Price from $651,332
ZS Price from $301,999


Promociones Exclusivas MG | Estrena con Beneficios | MG Motor México
Aprovecha las mejores promociones de MG y estrena tu auto con financiamiento, bonos y beneficios exclusivos. Descubre nuestras ofertas y conduce un MG hoy mismo.
remember Mister propaganda the USA has a 100% tariff on BYD cars regardless made in mexico or China so double the price and convert to USA dollars BYD can not compete.
Consider MG very likely dumps the cars at a very cheap price they do not manufacture in Mexico

How much does a Zacua, the Mexican electric car, cost in 2024?
The price of these cars in 2024 is 499 thousand 900 Mexican pesos paying for the car in cash and if the Zacua MX®2 and Zacua MX®3 models are chosen, these vehicles can be purchased in cash, through bank credit or an exclusive plan directly in the physical store.

Auto eléctrico mexicano Zacua: cuánto cuesta en 2024
Consulta el precio del auto eléctrico Zacua que se produce en la ciudad de Puebla.
Last edited:
- Joined
- Jul 3, 2024
- Messages
- 1,718
- Likes
- 2,293
In Mexico, there are approximately 1,500 electric charging stations, of which about 70% are public and 30% private. These stations are located mainly in Mexico City, Nuevo Leon and Aguascalientes, which account for 50% of the total. Most of these stations are free and are located in shopping malls, but private stations do not charge more than 80 pesos for a full recharge. The authorized recharge time can range from 30 minutes to 2 hours.I don't think India has better internet penetration rate than Chin, even population is slightly larger.
But it's anyway good market for mobiles. 80% share by Chinese brands.
View attachment 7818
Currently, Mexico City has launched its first production line. Zacua will gradually open around 150 electric charging stations in Mexico City, which it will map on a smartphone app, along with all other functional electric charging stations in Mexico City.

Auto eléctrico mexicano - Zacua - Acelera el futuro
Zacua, es un auto 100% eléctrico, 0 emisiones, mexicano y comprometido con la sustentabilidad y la movilidad responsable.
Harsh reality Mister propaganda Mexico has more electric station than most latin american countries and do not justify EVs at all so I hope you sell a lot of BYDs at those prices and so few recharging stations in Nicaragua or Bolivia add swap batteries to increase pollution and exploit african children mister CCP lies suckling baby add polluting Bolivia with polluted water
- Joined
- Jul 1, 2024
- Messages
- 1,900
- Likes
- 10,194
- Joined
- Jul 3, 2024
- Messages
- 792
- Likes
- 374

GII Science and Technology Clusters 2024: Tokyo-Yokohama and Shenzhen-Hong Kong-Guangzhou Top the Ranking; Emerging Economies Make their Move
China and the United States (US) are home to the world’s largest science and technology (S&T) clusters, with shifts among the top 100 showing especially fast growth of innovative activity in certain emerging economies, according to an early release from the 2024 edition of WIPO’s Global...
 www.wipo.int

GII Science and Technology Clusters 2024: Tokyo-Yokohama and Shenzhen-Hong Kong-Guangzhou Top the Ranking; Emerging Economies Make their Move
China and the United States (US) are home to the world’s largest science and technology (S&T) clusters, with shifts among the top 100 showing especially fast growth of innovative activity in certain emerging economies, according to an early release from the 2024 edition of WIPO’s Global...
GII Science and Technology Clusters 2024: Tokyo-Yokohama and Shenzhen-Hong Kong-Guangzhou Top the Ranking; Emerging Economies Make their Move
Geneva, August 27, 2024PR/2024/924
China and the United States (US) are home to the world’s largest science and technology (S&T) clusters, with shifts among the top 100 showing especially fast growth of innovative activity in certain emerging economies, according to an early release from the 2024 edition of WIPO’s Global Innovation Index (GII).
Each year, the GII ranks countries and economies around the world. In a pre-release ahead of a September 26, 2024 GII launch, the GII top-100 S&T Cluster ranking
Launched during IP Week @ SG 2024, a premier annual intellectual property-focused event hosted by the Intellectual Property Office of Singapore, the GII S&T Cluster ranking shows that among the top 10 clusters, seven are found in Asia and three in the US.
Tokyo-Yokohama (Japan) leads as the largest global S&T cluster, followed by Shenzhen-Hong Kong-Guangzhou (China and Hong Kong, China). Beijing (China) moved up one rank from last year to take the third position. In sixth place, San Jose–San Francisco, California is the leading US cluster. China, for the second consecutive year, leads with the most clusters (26) in the top 100. The US follows closely behind with 20 clusters.
While there is little change among the top 10 S&T clusters, a different picture emerges when looking at the top 100. Clusters located in middle-income economies experienced the strongest S&T growth, with Chinese clusters seeing the steepest increases in S&T output, led by Hefei (+23%) and Zhengzhou (19%). Cairo (Egypt, with 11% S&T output growth) experienced the highest growth rate amongst other middle-income economy clusters, followed by Chennai (India, +8%) and Istanbul (Turkey, +8%).
Conversely, clusters in high-income economies generally grew at a slower pace than those located in middle-income economies, with 37 out of the 63 high-income clusters witnessing negative S&T output growth in 2023. Most North American and European clusters fell in the ranking.
Science and technology clusters serve as the foundation of robust national innovation ecosystems. It is encouraging to see these clusters thriving not just in the mature hubs of industrialized nations, but also in the emerging innovation hotspots of selected developing economies. WIPO will continue to help these clusters to use IP to translate promising research into tangible, real-world solutions.
WIPO Director General Daren Tang
Video: View the 10 biggest GII Science and Technology Clusters
Video: What is the Global Innovation Index (GII)?
In addition to China, seven other middle-income economies have clusters among the top 100
- Brazil (1 cluster), with São Paulo (ranked 73rd among the top 100), the sole top 100 S&T cluster within Latin America;
- Egypt (1), with Cairo (95th), the sole top 100 S&T cluster within Africa;
- India (4), with Bengaluru (56th), Delhi (63rd), Chennai (82nd) and Mumbai (84th);
- Islamic Republic of Iran (1), with Tehran (38th);
- Malaysia (2), with Kuala Lumpur (93rd) and its cross-border cluster shared with Singapore (33rd);
- Russian Federation (1), with Moscow (31st); and
- Türkiye (2), with Istanbul (59th) and Ankara (86th).
In other findings:
- China continues to lead with the most clusters (26) in the top 100, up from 24 clusters last year. Shenzhen–Hong Kong–Guangzhou (ranked 2nd globally) leads, followed by Beijing (3rd), Shanghai–Suzhou (5th) and Nanjing (9th).
- The US has 20 clusters among the top 100, followed by Germany with eight, and India and the Republic of Korea with four each. San Jose–San Francisco is the leading cluster for the US, Munich for Germany, Bengaluru for India, and Seoul for the Republic of Korea.
- The Cambridge cluster in the United Kingdom and San Jose–San Francisco in the US are the clusters with the most intensive S&T activity in proportion to population size, followed by Eindhoven (Netherlands), Oxford (UK), and Boston–Cambridge, MA (US).
- The GII 2024 also looks beyond the top 100 at the top 50 African S&T clusters. Egypt has the most clusters (11, with Cairo and Alexandria leading), followed by South Africa (8, with Johannesburg leading), and Morocco (5, with Rabat leading).
Top 15 Global S&T Clusters by Size, 2024
[TABLE=table,table-striped][TR]
[td]Rank[/td]
[td]Cluster name[/td]
[td]Economy[/td]
[/TR]
[TR]
[td]1[/td]
[td]Tokyo–Yokohama[/td]
[td]JP[/td]
[/TR]
[TR]
[td]2[/td]
[td]Shenzhen–Hong Kong–Guangzhou[/td]
[td]CN/HK[/td]
[/TR]
[TR]
[td]3[/td]
[td]Beijing[/td]
[td]CN[/td]
[/TR]
[TR]
[td]4[/td]
[td]Seoul[/td]
[td]KR[/td]
[/TR]
[TR]
[td]5[/td]
[td]Shanghai–Suzhou[/td]
[td]CN[/td]
[/TR]
[TR]
[td]6[/td]
[td]San Jose–San Francisco, CA[/td]
[td]US[/td]
[/TR]
[TR]
[td]7[/td]
[td]Osaka–Kobe–Kyoto[/td]
[td]JP[/td]
[/TR]
[TR]
[td]8[/td]
[td]Boston–Cambridge, MA[/td]
[td]US[/td]
[/TR]
[TR]
[td]9[/td]
[td]Nanjing[/td]
[td]CN[/td]
[/TR]
[TR]
[td]10[/td]
[td]San Diego, CA[/td]
[td]US[/td]
[/TR]
[TR]
[td]11[/td]
[td]New York City, NY[/td]
[td]US[/td]
[/TR]
[TR]
[td]12[/td]
[td]Paris[/td]
[td]FR[/td]
[/TR]
[TR]
[td]13[/td]
[td]Wuhan[/td]
[td]CN[/td]
[/TR]
[TR]
[td]14[/td]
[td]Hangzhou[/td]
[td]CN[/td]
[/TR]
[TR]
[td]15[/td]
[td]Nagoya[/td]
[td]JP[/td]
[/TR]
[/TABLE]
Browse detailed briefs on each GII S&T top global clusters including information on the main scientific and patenting contributors or enterprises.
About GII Science and Technology Clusters
The GII science and technology clusters are one element in the larger Global Innovation Index (GII), which takes the pulse of the most recent trends in global innovation. The GII science and technology clusters identifies local concentrations of world-leading science and technology (S&T) activity around the globe, using a bottom-up approach. S&T clusters are established through the analysis of patent-filing activity and scientific article publication, documenting the geographical areas around the world with the highest density of inventors and scientific authors. Two innovation metrics are employed in the compilation of the top 100 GII S&T clusters worldwide[1]. The first metric focuses on the location of inventors listed in published patent applications under the WIPO Patent Cooperation Treat (PCT)[2]. The second metric considers the authors listed on published scientific articles.WIPO locates and ranks science and technology clusters through a geocoding method, mapping addresses and names pulled from documents to a 96% accuracy.
- Joined
- Jul 3, 2024
- Messages
- 1,718
- Likes
- 2,293

GII Science and Technology Clusters 2024: Tokyo-Yokohama and Shenzhen-Hong Kong-Guangzhou Top the Ranking; Emerging Economies Make their Move
China and the United States (US) are home to the world’s largest science and technology (S&T) clusters, with shifts among the top 100 showing especially fast growth of innovative activity in certain emerging economies, according to an early release from the 2024 edition of WIPO’s Global...www.wipo.int
GII Science and Technology Clusters 2024: Tokyo-Yokohama and Shenzhen-Hong Kong-Guangzhou Top the Ranking; Emerging Economies Make their Move
Geneva, August 27, 2024
PR/2024/924
China and the United States (US) are home to the world’s largest science and technology (S&T) clusters, with shifts among the top 100 showing especially fast growth of innovative activity in certain emerging economies, according to an early release from the 2024 edition of WIPO’s Global Innovation Index (GII).
Each year, the GII ranks countries and economies around the world. In a pre-release ahead of a September 26, 2024 GII launch, the GII top-100 S&T Cluster rankinglooks closer to the ground - using patent filing and scientific publishing data to identify local concentrations of world-leading science and technology activity.
Launched during IP Week @ SG 2024, a premier annual intellectual property-focused event hosted by the Intellectual Property Office of Singapore, the GII S&T Cluster ranking shows that among the top 10 clusters, seven are found in Asia and three in the US.
Tokyo-Yokohama (Japan) leads as the largest global S&T cluster, followed by Shenzhen-Hong Kong-Guangzhou (China and Hong Kong, China). Beijing (China) moved up one rank from last year to take the third position. In sixth place, San Jose–San Francisco, California is the leading US cluster. China, for the second consecutive year, leads with the most clusters (26) in the top 100. The US follows closely behind with 20 clusters.
While there is little change among the top 10 S&T clusters, a different picture emerges when looking at the top 100. Clusters located in middle-income economies experienced the strongest S&T growth, with Chinese clusters seeing the steepest increases in S&T output, led by Hefei (+23%) and Zhengzhou (19%). Cairo (Egypt, with 11% S&T output growth) experienced the highest growth rate amongst other middle-income economy clusters, followed by Chennai (India, +8%) and Istanbul (Turkey, +8%).
Conversely, clusters in high-income economies generally grew at a slower pace than those located in middle-income economies, with 37 out of the 63 high-income clusters witnessing negative S&T output growth in 2023. Most North American and European clusters fell in the ranking.
Video: View the 10 biggest GII Science and Technology Clusters
Video: What is the Global Innovation Index (GII)?
In addition to China, seven other middle-income economies have clusters among the top 100
- Brazil (1 cluster), with São Paulo (ranked 73rd among the top 100), the sole top 100 S&T cluster within Latin America;
- Egypt (1), with Cairo (95th), the sole top 100 S&T cluster within Africa;
- India (4), with Bengaluru (56th), Delhi (63rd), Chennai (82nd) and Mumbai (84th);
- Islamic Republic of Iran (1), with Tehran (38th);
- Malaysia (2), with Kuala Lumpur (93rd) and its cross-border cluster shared with Singapore (33rd);
- Russian Federation (1), with Moscow (31st); and
- Türkiye (2), with Istanbul (59th) and Ankara (86th).
In other findings:
- China continues to lead with the most clusters (26) in the top 100, up from 24 clusters last year. Shenzhen–Hong Kong–Guangzhou (ranked 2nd globally) leads, followed by Beijing (3rd), Shanghai–Suzhou (5th) and Nanjing (9th).
- The US has 20 clusters among the top 100, followed by Germany with eight, and India and the Republic of Korea with four each. San Jose–San Francisco is the leading cluster for the US, Munich for Germany, Bengaluru for India, and Seoul for the Republic of Korea.
- The Cambridge cluster in the United Kingdom and San Jose–San Francisco in the US are the clusters with the most intensive S&T activity in proportion to population size, followed by Eindhoven (Netherlands), Oxford (UK), and Boston–Cambridge, MA (US).
- The GII 2024 also looks beyond the top 100 at the top 50 African S&T clusters. Egypt has the most clusters (11, with Cairo and Alexandria leading), followed by South Africa (8, with Johannesburg leading), and Morocco (5, with Rabat leading).
Top 15 Global S&T Clusters by Size, 2024
[TABLE=table,table-striped]
[TR]
[td]Rank[/td]
[td]Cluster name[/td]
[td]Economy[/td]
[/TR]
[TR]
[td]1[/td]
[td]Tokyo–Yokohama[/td]
[td]JP[/td]
[/TR]
[TR]
[td]2[/td]
[td]Shenzhen–Hong Kong–Guangzhou[/td]
[td]CN/HK[/td]
[/TR]
[TR]
[td]3[/td]
[td]Beijing[/td]
[td]CN[/td]
[/TR]
[TR]
[td]4[/td]
[td]Seoul[/td]
[td]KR[/td]
[/TR]
[TR]
[td]5[/td]
[td]Shanghai–Suzhou[/td]
[td]CN[/td]
[/TR]
[TR]
[td]6[/td]
[td]San Jose–San Francisco, CA[/td]
[td]US[/td]
[/TR]
[TR]
[td]7[/td]
[td]Osaka–Kobe–Kyoto[/td]
[td]JP[/td]
[/TR]
[TR]
[td]8[/td]
[td]Boston–Cambridge, MA[/td]
[td]US[/td]
[/TR]
[TR]
[td]9[/td]
[td]Nanjing[/td]
[td]CN[/td]
[/TR]
[TR]
[td]10[/td]
[td]San Diego, CA[/td]
[td]US[/td]
[/TR]
[TR]
[td]11[/td]
[td]New York City, NY[/td]
[td]US[/td]
[/TR]
[TR]
[td]12[/td]
[td]Paris[/td]
[td]FR[/td]
[/TR]
[TR]
[td]13[/td]
[td]Wuhan[/td]
[td]CN[/td]
[/TR]
[TR]
[td]14[/td]
[td]Hangzhou[/td]
[td]CN[/td]
[/TR]
[TR]
[td]15[/td]
[td]Nagoya[/td]
[td]JP[/td]
[/TR]
[/TABLE]
Browse detailed briefs on each GII S&T top global clusters including information on the main scientific and patenting contributors or enterprises.
About GII Science and Technology Clusters
The GII science and technology clusters are one element in the larger Global Innovation Index (GII), which takes the pulse of the most recent trends in global innovation. The GII science and technology clusters identifies local concentrations of world-leading science and technology (S&T) activity around the globe, using a bottom-up approach. S&T clusters are established through the analysis of patent-filing activity and scientific article publication, documenting the geographical areas around the world with the highest density of inventors and scientific authors. Two innovation metrics are employed in the compilation of the top 100 GII S&T clusters worldwide[1]. The first metric focuses on the location of inventors listed in published patent applications under the WIPO Patent Cooperation Treat (PCT)[2]. The second metric considers the authors listed on published scientific articles.
WIPO locates and ranks science and technology clusters through a geocoding method, mapping addresses and names pulled from documents to a 96% accuracy.
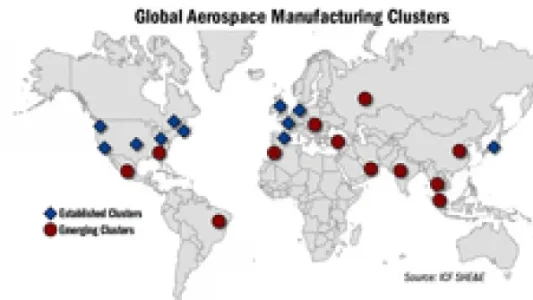
what what Queretato is there
The arrival of aerospace companies in Mexico continues without interruption. Foreign direct investment (FDI) received by Mexico through aerospace totalled $1 billion and generated over $4 billion dollars in exports. At present, the country has 300 aerospace companies spread across 15 states, but it is showing Querétaro’s potential. The state accounts for almost a quarter of the country’s aerospace companies and enterprise exports are equivalent to 36 per cent of the total in the country.
Within walking distance of the Intercontinental Airport of Querétaro is AeroTech Industrial Park, the result of a strategic alliance between American Industries Group and Abitat Constructora Queretana. The space has an area of __85 hectares and a capacity for about 24 industrial buildings, which is expected to create 300 direct jobs for every one of them. At full capacity, the aerospace park would provide 7,000 direct jobs for the region.
AeroTech is defined as an integrated aerospace cluster that connects producers, research and development, design and engineering, universities and technical schools. Also known as Querétaro Aerospace Valley, the park has 30 aerospace companies and suppliers manufacturers, three MRO’s, three centres of innovation and development, three design and engineering centres, five service companies, three educational institutions and a network of innovation and research. Overall, 50 active members have so far generated 3,600 direct jobs and an estimated growth projected at 255 per cent for 2012.
 www.theworldfolio.com
Within walking distance of the Intercontinental Airport of Querétaro is AeroTech Industrial Park, the result of a strategic alliance between American Industries Group and Abitat Constructora Queretana. The space has an area of __85 hectares and a capacity for about 24 industrial buildings, which is expected to create 300 direct jobs for every one of them. At full capacity, the aerospace park would provide 7,000 direct jobs for the region.
AeroTech is defined as an integrated aerospace cluster that connects producers, research and development, design and engineering, universities and technical schools. Also known as Querétaro Aerospace Valley, the park has 30 aerospace companies and suppliers manufacturers, three MRO’s, three centres of innovation and development, three design and engineering centres, five service companies, three educational institutions and a network of innovation and research. Overall, 50 active members have so far generated 3,600 direct jobs and an estimated growth projected at 255 per cent for 2012.
A landing strip for aerospace companies
The arrival of aerospace companies in Mexico continues without interruption. Foreign direct investment (FDI) received by Mexico through aerospace totalled $1 billion and generated over $4 billion dollars in exports. At present, the country has 300…
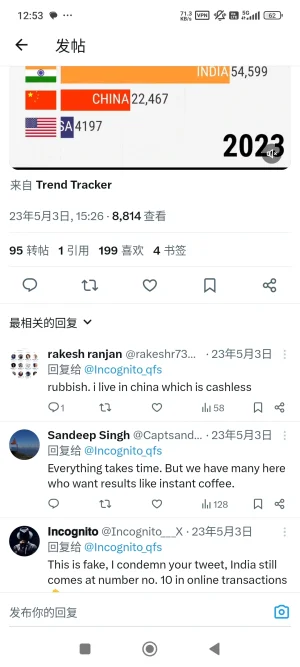

China and India lead the charge as digital wallets overtake cash and cards in Asia
China was the global leader in 2023, as 82% of e-commerce spending and 66% of physical purchases were made with digital wallets, totaling to around $7.6 trillion worth of transactions.
“China’s payment market is overwhelmingly led by three ubiquitous payment brands: the digital wallets Alipay and WeChat Pay, and the card network UnionPay,” the report said.
By 2027, 86% of e-commerce and 79% of in-store sales in China will be transacted using digital wallets, the report predicted.
“Many people in China no longer have a physical wallet in hand and they leave the house only carrying their mobile phone,” said Pomford.
India, the world’s most populous country with the largest youth population, isn’t trailing too far behind.

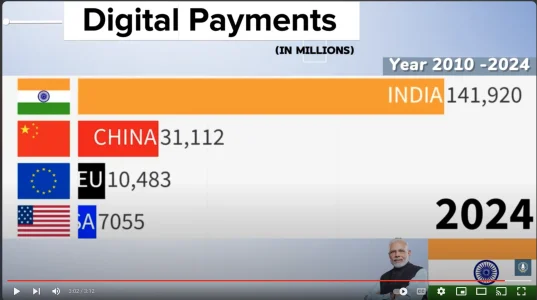
You are confusing digital wallets with digital transactions. India is #1 in the world in digital transactions.

 www.thehindu.com

 theprint.in

India accounts for 46% of all digital payments in the world: RBI governor
RBI Governor Shaktikanta Das reports 90-fold growth in digital transactions in India, with UPI leading the way.

"Daily digital transactions in India using UPI equivalent to population of EU," PM Modi highlights success of India's Digital public infrastructure
New Delhi [India], August 22 (ANI): Speaking at the Indian Diaspora event in Warsaw on Wednesday, Prime Minister Narendra Modi highlighted the significance of digital transactions by drawing a comparison, noting that the daily volume of digital transactions conducted through UPI in India now...
 theprint.in
Users who are viewing this thread
Total: 2 (members: 0, guests: 2)
Latest Replies
-
Indian Economy
- Prasad
-
DRDO & PSUs
- snakeeyes07
-
Operation Sindoor & Aftermath
- snakeeyes07
-
Tracking Indian Judiciary: News, Updates & Discussions
- swesh Annonamys Sanatani
-
Naxal Maoist Insurgency
- swesh Annonamys Sanatani
-
Sinking State of Bangladesh: Idiotic Musings
- The Juggernaut
-
Russian Ukrainian War
- Soldier35
-
Indian Army: News and Updates
- ArjunMK1A
-
Jokes Thread
- Unknowncommando

