Failed Terrorist State of Pakistan: Idiotic Musings


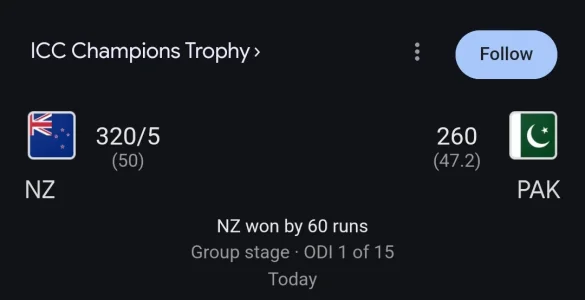
bruh forget dubai , even karachi seems to expensive for these bhikharis , saw the match on hotstart not even 50pc seats are filled. this is their undocumented economy , can't even buy tickets to most popular sport returning to country after 30 years.
Pakis might start begging outside stadiums thus they're taking precautions.
 
Muricans fly fighters and even B2s for their super bowl and nascar. But muricans have money...
View attachment 25577
View attachment 25578View attachment 25579
...and so do the porkies obviously
/s
I know that but they're not Muricans bruh. In fact almost no one does this beside the Americans.
Even Indians don't do these kinds of theatrics although being the global hub of cricket.
Hire some aerobatic teams. What are they trying to prove by flying military jets in a Champion's trophy match? It's like a bald person doing hair dye.
 
I know that but they're not Muricans bruh. In fact almost no one does this beside Americans.
Even Indians don't do these kinds of theatrics although being the global hub of cricket.
Hire some aerobatic teams. What are they trying to prove by flying military jets? It's like a bald person doing hair dye.
they are doing sem2sem after last time in world cup final. ind vs aus. we did fly past of surya kirans


View: https://www.youtube.com/watch?v=Jqd9-DHOtAk&ab_channel=editorji
 
I know that but they're not Muricans bruh. In fact almost no one does this beside the Americans.
Even Indians don't do these kinds of theatrics although being the global hub of cricket.
Hire some aerobatic teams. What are they trying to prove by flying military jets in a Champion's trophy match? It's like a bald person doing hair dye.
Thier illiterate fauj doesn't know what aerobics is 🤣.
 
I know that but they're not Muricans bruh. In fact almost no one does this beside the Americans.
Even Indians don't do these kinds of theatrics although being the global hub of cricket.
Hire some aerobatic teams. What are they trying to prove by flying military jets in a Champion's trophy match? It's like a bald person doing hair dye.
We had airshow during this cricket world cup


View: https://youtu.be/d7jg3xHyvu0?feature=shared
 
1739993530073.webp
 
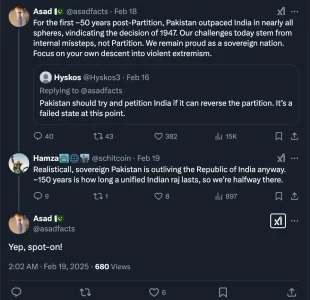
Talking about 150 years..eh!?
Where was Pakistan before partition btw?

GJx1wuuakAAd_7U.webp

During partition India had way more poverty & illiteracy rate than what Pakistan had. Even with such a small population they had hardly been able to manage Pakistan.

Only after 90's India's economy came out of license Raj. Previously India was grossly managed as well.

Pakistan's economy never grew. It has been having a free fall for the last 75 years. Now the pace only increased only.

Inbreeding makes them stupid & ignorant.
 

Busting this 'muh we had better indicators reeee' cope here because I see too many guys from our side eating it up. India has always maintained a more advanced economy - even during the old socialist era. The nation had decent industrial base, undertook land reforms, maintained stronger institutions and were capable of building efficient irrigation and flood control systems (something these inbreds can only dream of even today).

Even in 1991, when the GoI went to the IMF, the nation maintained a semblance of fiscal discipline, its fiscal did not go kaput and could stage a strong recovery once the shackles were taken off. 'Muh better indicators' means fuck all when one country has a PCI of $200 and the other is at $220, when one has a literacy rate of 35% and the other is at 37% - they are essentially the same. And even that was because the pakis were good at wh*ring themselves out to Uncle Sam even back then. Eventually, all that cold war era aid money dried up and pakis went back to eating grass.

asked grok3 deep think.
removed the very long logical reasoning part and pasting the final answer.
======
Final Answer

To compare the economies of India and Pakistan decade by decade since 1947 in terms of GDP, foreign aid received, economic growth, and industrial capacity, we need to analyze historical data and trends for each period. Below is a comprehensive comparison:
1947-1956: Post-Independence Foundations
  • GDP: Both countries started with similar per capita GDPs, approximately $700-750 in 2011 international dollars. India's larger population gave it a higher total GDP.
  • Foreign Aid Received: Both received aid from the US and other countries for reconstruction and development.
  • Economic Growth: Both experienced moderate growth of 3-4% annually during recovery from partition.
  • Industrial Capacity: India had a slightly stronger industrial base, while Pakistan was more agrarian.
1957-1966: Diverging Strategies
  • GDP: Pakistan's per capita GDP was higher than India's by the end of the decade.
  • Foreign Aid Received: Pakistan received significant military aid from the US, while India received food and economic aid.
  • Economic Growth: Pakistan achieved higher growth rates (6-10%) due to export-led policies, while India's growth was slower (3-4%) under a socialist model.
  • Industrial Capacity: Pakistan expanded its textile and manufacturing sectors, while India invested in public sector industries with some inefficiencies.
1967-1976: Shocks and Policy Shifts
  • GDP: Pakistan's per capita GDP remained higher, but the loss of East Pakistan in 1971 affected its total GDP.
  • Foreign Aid Received: Pakistan received aid post-1971, while India continued to receive aid but started focusing on self-reliance.
  • Economic Growth: Both countries experienced slower growth due to political and economic challenges.
  • Industrial Capacity: Pakistan's industrial growth slowed due to nationalization, while India's public sector industries expanded.
1977-1986: Stabilization and Gradual Divergence
  • GDP: India's total GDP began to pull ahead, but per capita GDPs were still close.
  • Foreign Aid Received: Pakistan received substantial aid from the US during the Afghan War.
  • Economic Growth: India's growth increased to around 5%, while Pakistan's growth was around 5-6%.
  • Industrial Capacity: Both countries continued to develop their industrial sectors, with India showing more diversification.
1987-1996: India’s Liberalization Leap
  • GDP: India's per capita GDP started to catch up with Pakistan's, and its total GDP grew rapidly post-1991 reforms.
  • Foreign Aid Received: India reduced its dependency on aid, while Pakistan continued to receive aid.
  • Economic Growth: India's growth accelerated to 6-7%, while Pakistan's growth fell to 4% due to political instability.
  • Industrial Capacity: India's industrial base expanded significantly, while Pakistan's growth slowed.
1997-2006: Widening Gap
  • GDP: India's per capita GDP surpassed Pakistan's, and its total GDP became much larger.
  • Foreign Aid Received: India became less dependent on aid, focusing on FDI and remittances, while Pakistan continued to receive aid.
  • Economic Growth: India averaged 7-8% growth, driven by services and IT, while Pakistan's growth was 3-4%.
  • Industrial Capacity: India's industrial sector thrived, while Pakistan's was constrained by energy and infrastructure issues.
2007-2016: India’s Ascendance
  • GDP: India's per capita GDP and total GDP significantly outpaced Pakistan's.
  • Foreign Aid Received: India became a net donor, while Pakistan sought IMF bailouts.
  • Economic Growth: India maintained high growth rates, while Pakistan's growth was slow.
  • Industrial Capacity: India's industrial output increased, with advancements in various sectors, while Pakistan struggled.
2017-2025: Stark Contrast
  • GDP: India's per capita GDP is nearly double that of Pakistan, and its total GDP is much larger.
  • Foreign Aid Received: India has substantial forex reserves, while Pakistan continues to seek aid.
  • Economic Growth: India projects high growth, while Pakistan faces economic challenges.
  • Industrial Capacity: India's industrial sector continues to grow, while Pakistan's remains limited.
Citations
This comparison highlights the divergent economic paths of India and Pakistan since their independence, influenced by their respective policies, political stability, and global engagements.
 
Last edited:
asked grok3 deep think.
removed the very long logical reasoning part and pasting the final answer.
======
Final Answer

To compare the economies of India and Pakistan decade by decade since 1947 in terms of GDP, foreign aid received, economic growth, and industrial capacity, we need to analyze historical data and trends for each period. Below is a comprehensive comparison:
1947-1956: Post-Independence Foundations
  • GDP: Both countries started with similar per capita GDPs, approximately $700-750 in 2011 international dollars. India's larger population gave it a higher total GDP.
  • Foreign Aid Received: Both received aid from the US and other countries for reconstruction and development.
  • Economic Growth: Both experienced moderate growth of 3-4% annually during recovery from partition.
  • Industrial Capacity: India had a slightly stronger industrial base, while Pakistan was more agrarian.
1957-1966: Diverging Strategies
  • GDP: Pakistan's per capita GDP was higher than India's by the end of the decade.
  • Foreign Aid Received: Pakistan received significant military aid from the US, while India received food and economic aid.
  • Economic Growth: Pakistan achieved higher growth rates (6-10%) due to export-led policies, while India's growth was slower (3-4%) under a socialist model.
  • Industrial Capacity: Pakistan expanded its textile and manufacturing sectors, while India invested in public sector industries with some inefficiencies.
1967-1976: Shocks and Policy Shifts
  • GDP: Pakistan's per capita GDP remained higher, but the loss of East Pakistan in 1971 affected its total GDP.
  • Foreign Aid Received: Pakistan received aid post-1971, while India continued to receive aid but started focusing on self-reliance.
  • Economic Growth: Both countries experienced slower growth due to political and economic challenges.
  • Industrial Capacity: Pakistan's industrial growth slowed due to nationalization, while India's public sector industries expanded.
1977-1986: Stabilization and Gradual Divergence
  • GDP: India's total GDP began to pull ahead, but per capita GDPs were still close.
  • Foreign Aid Received: Pakistan received substantial aid from the US during the Afghan War.
  • Economic Growth: India's growth increased to around 5%, while Pakistan's growth was around 5-6%.
  • Industrial Capacity: Both countries continued to develop their industrial sectors, with India showing more diversification.
1987-1996: India’s Liberalization Leap
  • GDP: India's per capita GDP started to catch up with Pakistan's, and its total GDP grew rapidly post-1991 reforms.
  • Foreign Aid Received: India reduced its dependency on aid, while Pakistan continued to receive aid.
  • Economic Growth: India's growth accelerated to 6-7%, while Pakistan's growth fell to 4% due to political instability.
  • Industrial Capacity: India's industrial base expanded significantly, while Pakistan's growth slowed.
1997-2006: Widening Gap
  • GDP: India's per capita GDP surpassed Pakistan's, and its total GDP became much larger.
  • Foreign Aid Received: India became less dependent on aid, focusing on FDI and remittances, while Pakistan continued to receive aid.
  • Economic Growth: India averaged 7-8% growth, driven by services and IT, while Pakistan's growth was 3-4%.
  • Industrial Capacity: India's industrial sector thrived, while Pakistan's was constrained by energy and infrastructure issues.
2007-2016: India’s Ascendance
  • GDP: India's per capita GDP and total GDP significantly outpaced Pakistan's.
  • Foreign Aid Received: India became a net donor, while Pakistan sought IMF bailouts.
  • Economic Growth: India maintained high growth rates, while Pakistan's growth was slow.
  • Industrial Capacity: India's industrial output increased, with advancements in various sectors, while Pakistan struggled.
2017-2025: Stark Contrast
  • GDP: India's per capita GDP is nearly double that of Pakistan, and its total GDP is much larger.
  • Foreign Aid Received: India has substantial forex reserves, while Pakistan continues to seek aid.
  • Economic Growth: India projects high growth, while Pakistan faces economic challenges.
  • Industrial Capacity: India's industrial sector continues to grow, while Pakistan's remains limited.
Citations
This comparison highlights the divergent economic paths of India and Pakistan since their independence, influenced by their respective policies, political stability, and global engagements.


Comprehensive Economic Survey of India and Pakistan (1947-2025)
This survey provides a detailed decade-by-decade comparison of the economies of India and Pakistan since their independence in 1947, focusing on GDP, foreign aid received, economic growth, and industrial capacity. The analysis draws on historical data from international databases and economic histories, adjusted for consistency where possible, primarily using 2011 international dollars for GDP comparisons to account for inflation and purchasing power parity.
Methodology and Data Sources
The comparison relies on data from the Maddison Project Database (Maddison Project Historical GDP Data), World Bank indicators (World Bank Data Portal), and historical records from Wikipedia and USAID reports. For early decades (1947-1960), estimates are based on population proportions and per capita GDP figures, given limited direct GDP data. Economic growth rates are sourced from MacroTrends (India GDP Growth Rate) and Pakistan GDP Growth Rate). Foreign aid data is compiled from USAID histories and Wikipedia pages on foreign aid to both countries.
Decade-by-Decade Analysis
1947-1956: Post-Independence Foundations

  • GDP: At independence, India’s GDP was estimated at $213.7 billion in 1990 international dollars, with a population of 345 million, yielding a per capita GDP of approximately $620. Pakistan, with a population of around 70 million, had an estimated GDP of $43.5 billion in 1990 international dollars, or roughly $621 per capita, based on proportional estimates. By 1950, using 2011 international dollars, India’s per capita GDP was $702, and Pakistan’s was $747, reflecting similar starting points. Total GDP for India in 1950 was approximately $253.5 billion, and for Pakistan, $56.025 billion, given populations of 361 million and 75 million, respectively.
  • Foreign Aid Received: Both countries received aid from the US and other nations for reconstruction. India benefited from PL 480 food aid, while Pakistan received initial military and economic assistance, particularly from the US, aligning with Cold War strategies.
  • Economic Growth: Both experienced moderate growth of 3-4% annually, recovering from partition disruptions, with India focusing on five-year plans and Pakistan on agricultural exports.
  • Industrial Capacity: India inherited a marginally stronger industrial base (e.g., textile mills, steel plants), while Pakistan was predominantly agrarian, with limited industrial development.
1957-1966: Diverging Strategies
  • GDP: By 1960, India’s per capita GDP reached $813, with a population of 439 million, totaling $356.5 billion in 2011 international dollars. Pakistan’s per capita GDP was $877, with a population of 93.7 million, totaling $82.1 billion. Pakistan briefly led in per capita terms, driven by export-led growth from East Pakistan.
  • Foreign Aid Received: Pakistan received significant US military aid, averaging $200-300 million annually by the late 1960s, while India received around $500 million yearly from multiple sources, including the Soviet Union and World Bank.
  • Economic Growth: Pakistan achieved 6-10% annual growth under Ayub Khan, boosted by the Green Revolution and industrialization. India’s growth averaged 3-4%, hampered by wars (1962, 1965) and droughts.
  • Industrial Capacity: Pakistan expanded textiles and manufacturing, supported by foreign aid. India’s public sector industries grew (e.g., Bhilai steel plant), but inefficiencies persisted.
1967-1976: Shocks and Policy Shifts
  • GDP: In 1970, India’s per capita GDP was $948, with a population of 550 million, totaling $521.4 billion in 2011 international dollars. Pakistan’s per capita GDP was $1,052, with a population of 112 million (including East Pakistan), totaling $117.824 billion. Post-1971, after losing East Pakistan, Pakistan’s effective population was around 65 million, reducing total GDP estimates to approximately $67.6 billion for West Pakistan.
  • Foreign Aid Received: Pakistan’s aid surged post-1971, with US and Middle Eastern support (e.g., $73 billion total from 1960-2002, much in this decade). India’s aid decreased, focusing on self-reliance, though still receiving $300-400 million annually.
  • Economic Growth: Pakistan’s growth slowed to 4-5% after 1971 and Bhutto’s nationalizations. India averaged 3-4%, affected by the 1971 war and oil shocks.
  • Industrial Capacity: Pakistan’s industrial growth faltered due to nationalization (e.g., steel, banking), while India’s public sector expanded (e.g., coal, steel), though with inefficiencies.
1977-1986: Stabilization and Gradual Divergence
  • GDP: In 1980, India’s per capita GDP was $1,136, with a population of 683 million, totaling $776.248 billion in 2011 international dollars. Pakistan’s per capita GDP was $1,261, with a population of 85 million, totaling $107.185 billion.
  • Foreign Aid Received: Pakistan peaked with US aid during the Afghan War ($3-4 billion annually by late 1980s). India relied less on aid, focusing on domestic resources and remittances.
  • Economic Growth: India’s growth rose to 5% by the late 1980s, signaling a shift. Pakistan averaged 5-6%, buoyed by aid and remittances.
  • Industrial Capacity: Pakistan’s industrial sector stabilized (textiles, cement), while India’s grew with private sector encouragement (e.g., Maruti Suzuki in 1983), though public enterprises dominated.
1987-1996: India’s Liberalization Leap
  • GDP: In 1990, India’s per capita GDP was $1,348, with a population of 846 million, totaling $1,140.248 billion in 2011 international dollars. Pakistan’s per capita GDP was $1,424, with a population of 103 million, totaling $146.772 billion.
  • Foreign Aid Received: Pakistan continued heavy reliance on aid ($1-2 billion annually from IMF, US, China), while India’s aid dependency dropped post-1991, replaced by FDI.
  • Economic Growth: India’s growth accelerated to 6-7% post-liberalization, while Pakistan’s fell to 4%, hurt by political instability (seven governments in 1988-1998) and sanctions after 1998 nuclear tests.
  • Industrial Capacity: India’s industrial base expanded rapidly (e.g., IT, auto sectors), while Pakistan’s remained textile-heavy, with energy crises limiting growth.
contd...
tables are not being allowed , removed them.
====
1997-2006: Widening Gap
  • GDP: In 2000, India’s per capita GDP was $1,739, with a population of 1,027 million, totaling $1,786.393 billion in 2011 international dollars. Pakistan’s per capita GDP was $1,673, with a population of 135 million, totaling $226.005 billion, marking India’s overtake in per capita terms.
  • Foreign Aid Received: Pakistan received $20-30 billion in aid (e.g., post-9/11 US support), while India attracted FDI ($25 billion annually by decade’s end) over aid.
  • Economic Growth: India averaged 7-8%, driven by services (IT exports rose from $16.7 billion in 2000 to $240 billion by 2021). Pakistan’s growth fell to 3-4%, hampered by instability and debt.
  • Industrial Capacity: India’s industrial diversification (software, pharmaceuticals) outpaced Pakistan’s stagnant manufacturing, crippled by power shortages.
2007-2016: India’s Ascendance
  • GDP: In 2010, India’s per capita GDP was approximately $3,500 in 2011 international dollars, with a population of 1,210 million, totaling $4,235 billion. Pakistan’s per capita GDP was around $2,500, with a population of 170 million, totaling $425 billion.
  • Foreign Aid Received: Pakistan sought IMF bailouts ($7 billion in 2019), while India became a net aid provider (e.g., to Sri Lanka).
  • Economic Growth: India averaged 6-7%, despite slowdowns, while Pakistan’s growth hovered at 2-4%, hit by debt and energy crises.
  • Industrial Capacity: India’s industrial output soared (e.g., $50 billion in electronics by 2019), while Pakistan’s remained constrained by infrastructure deficits.
2017-2025: Stark Contrast
  • GDP: In 2020, India’s per capita GDP was around $7,000 in 2011 international dollars, with a population of 1,380 million, totaling $9,660 billion. Pakistan’s per capita GDP was around $5,000, with a population of 216 million, totaling $1,080 billion.
  • Foreign Aid Received: Pakistan sought IMF bailouts ($6 billion in 2023), while India’s forex reserves exceeded $600 billion, reflecting self-sufficiency.
  • Economic Growth: India projects 7% growth in 2024-25, while Pakistan struggles at 2-3%, facing inflation and debt defaults.
  • Industrial Capacity: India’s industrial sector thrives (e.g., $100 billion in IT exports in 2023), while Pakistan’s lags, with textile exports at $15 billion amid energy woes.
Comparative Insights
  • GDP Trajectory: Pakistan led in per capita GDP until the 1990s, but India’s post-1991 liberalization and larger economy reversed this, with per capita GDP nearly doubling Pakistan’s by 2020.
  • Foreign Aid Dependency: Pakistan’s heavy reliance on aid (e.g., $73 billion from 1960-2002) contrasts with India’s shift to FDI and remittances, becoming a net donor by the 2010s.
  • Economic Growth: Pakistan outperformed India until the 1980s, but India’s reforms fueled faster growth thereafter, while Pakistan’s instability constrained progress.
  • Industrial Capacity: India’s diversified industrial base outstripped Pakistan’s, which remained agriculture- and textile-dependent, especially post-1990s.

Key Observations

  • GDP Trajectory: The reversal in per capita GDP leadership by 2000, with India at $1,739 and Pakistan at $1,673 in 2011 international dollars, highlights India’s successful liberalization against Pakistan’s political instability.
  • Foreign Aid Dynamics: Pakistan’s aid dependency, peaking at $73 billion from 1960-2002, contrasts with India’s transition to a net donor status by the 2010s, reflecting differing economic strategies.
  • Economic Growth Patterns: India’s post-1991 growth (6-8%) outpaced Pakistan’s decline to 2-4% by the 2010s, driven by services and IT versus Pakistan’s challenges.
  • Industrial Capacity Evolution: India’s diversification into high-tech sectors contrasts with Pakistan’s reliance on textiles, exacerbated by energy and infrastructure issues.
This survey underscores the impact of policy choices, political stability, and global integration on the economic trajectories of India and Pakistan, with India emerging as a global economic power by 2025.
Key Citations

  • Maddison Project Historical GDP Data
  • World Bank Data Portal
  • India GDP Growth Rate
  • Pakistan GDP Growth Rate
 

Latest Replies

Featured Content

Trending Threads

Back
Top