Budget 2025 (1 Viewer)

2.5% is still rather low ngl. For a brief period of time we were spending 2.5 to 2.8% of GDP that too during this government. I don't know why they became ultra kanjoos after that. Leader ji wasn't always kanjoos. You can see from 2014-15 till 2021-22 defence spending was on upward trend. From 2022-23 he has gone ultra kanjoos mode.View attachment 42579

check the defence budget against union budget expenditure instead of GDP.
 
check the defence budget against union budget expenditure instead of GDP.
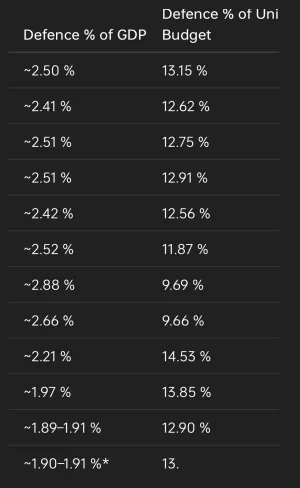
It seems to be hovering between 12% to 14% of the total budget in last decade. You are right % of GDP is kinda misleading. For example the defence budget in 2020-22 seems a lot in % of GDP term but from budgetary allocation perspective, it had actually decreased to 9%.
Screenshot_2025-07-07-18-06-21-61_96b26121e545231a3c569311a54cda96.webp
 
Last edited:
It seems to be hovering between 12% to 14% of the total budget in last decade. You are right % of GDP is kinda misleading. For example the defence budget in 2020-22 seems a lot in % of GDP term but from budgetary allocation perspective, it had actually decreased to 9%.
View attachment 42586

here you go, a bit more elaborate data.
there will be minor corrections, trend will largely hold good.

YearTotal GDP (₹ Cr)Union Budget Expenditure (₹ Cr)Defense Budget BE (₹ Cr)Capex (₹ Cr)% of Union Budget to GDP% of Defense Budget BE to Union Budget% of Capex to Defense Budget BE% of Defense Budget BE to GDP
20141,24,68,00016,63,7002,29,00094,587.9513.34%13.76%41.30%1.84%
20151,37,72,00017,90,8002,47,00085,894.4413.00%13.79%34.78%1.79%
20161,53,92,00019,75,2002,40,00078,586.6812.83%12.15%32.74%1.56%
20171,70,95,00021,42,0003,60,00086,488.0112.53%16.81%24.02%2.11%
20181,90,10,00023,15,1004,04,00093,982.1312.17%17.45%23.27%2.13%
20192,00,75,00026,86,3004,71,0001,03,394.3113.38%17.53%21.95%2.35%
20201,98,01,00035,17,0004,71,0001,13,734.0017.76%13.39%24.15%2.38%
20212,36,65,00037,91,3004,78,0001,35,060.7216.02%12.61%28.25%2.02%
20222,72,41,00041,94,8005,25,0001,52,369.6115.40%12.51%29.02%1.93%
20232,96,58,00046,14,7005,94,0001,62,600.0015.56%12.87%27.38%2.00%
20243,23,00,00048,20,0006,21,0001,72,000.0014.92%12.89%27.70%1.92%
2025*N/A50,65,0006,81,0001,80,000.00N/A13.44%26.43%N/A
 
Last edited:
here you go, a bit more elaborate data.
there will be minor corrections, trend will largely hold good.

YearTotal GDP (₹ Cr)Union Budget Expenditure (₹ Cr)Defense Budget BE (₹ Cr)Capex (₹ Cr)% of Union Budget to GDP% of Defense Budget BE to Union Budget% of Capex to Defense Budget BE% of Defense Budget BE to GDP
20141,24,68,00016,63,7002,29,00094,587.9513.34%13.76%41.30%1.84%
20151,37,72,00017,90,8002,47,00085,894.4413.00%13.79%34.78%1.79%
20161,53,92,00019,75,2002,40,00078,586.6812.83%12.15%32.74%1.56%
20171,70,95,00021,42,0003,60,00086,488.0112.53%16.81%24.02%2.11%
20181,90,10,00023,15,1004,04,00093,982.1312.17%17.45%23.27%2.13%
20192,00,75,00026,86,3004,71,0001,03,394.3113.38%17.53%21.95%2.35%
20201,98,01,00035,17,0004,71,0001,13,734.0017.76%13.39%24.15%2.38%
20212,36,65,00037,91,3004,78,0001,35,060.7216.02%12.61%28.25%2.02%
20222,72,41,00041,94,8005,25,0001,52,369.6115.40%12.51%29.02%1.93%
20232,96,58,00046,14,7005,94,0001,62,600.0015.56%12.87%27.38%2.00%
20243,23,00,00048,20,0006,21,0001,72,000.0014.92%12.89%27.70%1.92%
2025*N/A50,65,0006,81,0001,80,000.00N/A13.44%26.43%N/A
Now can you find the trend in data for what has been the allocation to R&D in defence budget? Like has it remain static or has changed? Maybe from 2009 to today.
 
Now can you find the trend in data for what has been the allocation to R&D in defence budget? Like has it remain static or has changed? Maybe from 2009 to today.

some of the values like capex can come only by going thru union budget documents for accuracy, it takes time, those are weekend sort of project. earlier table i had already been doing it before, combined existing tables and that one came about.

in expenditure budget(full) section of union budget, year by year.
I will look into it. Yeah ig this would take a few weeks.
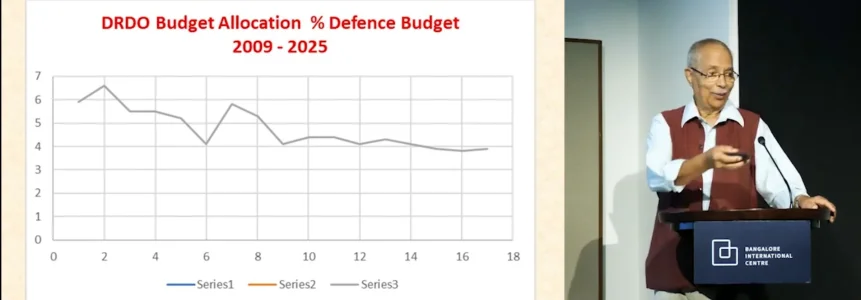
Anyways I was watching that seminar I shared and in that around 46:14 onwards Mr.Narayan share this interesting bit about the growth in budget allocation to DRDO where he puts down the difference in absolute growth vs percentile growth over time. This is what piqued my interest. I don't know if it was probably an unintentional error or he might not have access to the data but his graph only goes upto 2018. So I was curious about 2018-2025.
Screenshot_2025-07-07-22-29-15-81_f9ee0578fe1cc94de7482bd41accb329.webpScreenshot_2025-07-07-22-29-52-15_f9ee0578fe1cc94de7482bd41accb329.webp
 
Last edited:
not finding workers for hard labour locally means , the geography/region has moved up in per capita income.

not just that, in punjab it went full circle. they were one of the richest states early after green revolution, they started hiring workers from other states. wealthy landlords and state gormint got so used this, that they assumed this gravy train is going to last forever. they neglected industry, which drove industry out of punjab to other states.

now punjab is poorer per capita than haryana, and the state has the worst financial health in the country.
On ground of many indication punjab lags behind Haryana I have observed it on many parameters
 

Users who are viewing this thread

Latest Replies

Featured Content

Trending Threads

Back
Top