Supply chains will be diversified for sure. But the world is also becoming more protectionist as well. The globalization we experienced between 1980-2020 will be watered down going forward with some strategic capabilities being done in-house. Covid exposed a lot of vulnerabilities for many countries. So those supply chains will be domestic. For India this was APIs for pharmaceuticals and PPE equipment. Additionally defense equipment and the logistics supply chain was made using domestic technology (Vande Bharat) trains vs using Chinese or Japanese bullet trains. India and China can afford to do this because of the large consumer markets, however many countries will fall into the category which you are describing where they rely on global supply chain.here we have the typical lie everything China manufactures is by Chinese brands.
In the case of all nations they manufature goods from brands of all over the world.
View attachment 7947
Fantasy man remember we live ina global world everything has imput from many nations.
Even a Cell phone was made with ASML technology, Intel input, TSMC manufacture, built partially in China by a Korean company, using google .
Stop dreaming we live ina world where the biggest danger is some Idiots in China, Russia, Europe, Israel, Japan do not recognize a WWIII means a disaster for humanity and all we are dependant upon everyone
You are using an out of date browser. It may not display this or other websites correctly.
You should upgrade or use an alternative browser.
You should upgrade or use an alternative browser.
Chinese Economy Watch (7 Viewers)
- Thread starter rockdog
- Start date
More options
Who Replied?- Joined
- Jul 3, 2024
- Messages
- 1,721
- Likes
- 2,293
I totally agree it is a civilization state, same China or the EU, my point is not that India or China will not advance my point is globalization means we all are mutually dependant, economically goods are not made locally, but a jigsaw of different technologies borrowed and assambled like legos.
We all are becoming a global human civilization.
He boast China for example has BYD, but electric cars are not new, lithium batteries are not even Chinese they are american inventions, is the USA the only inventor, no of course no the letters we use are romans, based upon phoenician letters using arab-indian numbers
Battery swapping is even an american-israeli invention.
All civilizations are sharing, manufacture is the same.
If you fly embraer you fly a brazilian airplane with parts made all over the world, if you use a nokya or samsung telephone is the same.
It is easy to relate to people from our nations and harder to people from other nations, but the reality is we all are humans with the same capabilities.
- Joined
- Jul 3, 2024
- Messages
- 1,721
- Likes
- 2,293
Globalization in my opinion will not stop, even in Military goods example JF-17 shows China is not truely independent DSI intake is for exampole an american invention and J-20 has lots of stolen tech regardless they admit it.Supply chains will be diversified for sure. But the world is also becoming more protectionist as well. The globalization we experienced between 1980-2020 will be watered down going forward with some strategic capabilities being done in-house. Covid exposed a lot of vulnerabilities for many countries. So those supply chains will be domestic. For India this was APIs for pharmaceuticals and PPE equipment. Additionally defense equipment and the logistics supply chain was made using domestic technology (Vande Bharat) trains vs using Chinese or Japanese bullet trains. India and China can afford to do this because of the large consumer markets, however many countries will fall into the category which you are describing where they rely on global supply chain.
Y-20 has a lot of Ukranian input basically is an Antonov design.
F-35 is an international program, if you see protectionism is because protectionism is a way to force to cooperate。
Nothing these days is truely local, capitalism is evolving toward multinational companies with international input.
The nation state will disappear, the world government will control everything
It will continue but there will be strategic initiatives that allow countries to maintain their sovereignty. History has always shown that when sovereignty falls, there is war / violence. So I think it will be a give & take between global / domestic supply chain. It won't be black or white but will live on a spectrum.
- Joined
- Jun 30, 2024
- Messages
- 3,568
- Likes
- 30,754
1. Quality? paved or not paved?
2. Country road? Normal way or express way or high way?
3. You shouldn't use the same size of map, actually when you use a India map, you need use a China Map 3 TIMES larger, since we have 9.6million you have around 2.9million KM2. Then you see how long the road it should be comparing India.
4. Way of calcuation, we count by general lengh, you count "lane lenght"
5. I personally doubt about it based on economic reason:
View: https://x.com/thinking_panda/status/1798283216249630741?t=3umaOt3nnzrZP7k4c5xT9A&s=19
View: https://x.com/BeijingDai/status/1674701549334073344?t=5lPkk9Off6ujZBHH4kXwgg&s=19
Because India buys crores of 2 wheelers, and over a million commercial vehicles on top of cars that need roads.
I guess it is basic common sense.
View: https://x.com/TimesAlgebraIND/status/1819238498840330411?t=T4Cn63yK0bQRgQ14D0wciQ&s=19
I agree with him about gap between China & India.
View: https://youtu.be/B39hB75nZlo?si=mTahglxucyeNaQ7g
@srev2004 i also advice you spent 60sec for this clip, like him say i really don't have interest to argue those road length.
View attachment 7932
That was just a figure of speech, my guy.
- Joined
- Jul 3, 2024
- Messages
- 795
- Likes
- 374
I totally agree it is a civilization state, same China or the EU, my point is not that India or China will not advance my point is globalization means we all are mutually dependant, economically goods are not made locally, but a jigsaw of different technologies borrowed and assambled like legos.
We all are becoming a global human civilization.
He boast China for example has BYD, but electric cars are not new, lithium batteries are not even Chinese they are american inventions, is the USA the only inventor, no of course no the letters we use are romans, based upon phoenician letters using arab-indian numbers
Battery swapping is even an american-israeli invention.
All civilizations are sharing, manufacture is the same.
If you fly embraer you fly a brazilian airplane with parts made all over the world, if you use a nokya or samsung telephone is the same.
It is easy to relate to people from our nations and harder to people from other nations, but the reality is we all are humans with the same capabilities.
I'm not going to say that your statement is wrong.
But yours is a favorite theory in the developed West,
“If you fly embraer you fly a brazilian airplane with parts made all over the world, if you use a nokya or samsung telephone is the same.”
This actually confuses the difference between core technology and general technology, core parts and general parts.
“All civilizations are sharing, manufacture is the same.”
Rich and poor countries disagree
- Joined
- Jul 3, 2024
- Messages
- 795
- Likes
- 374
ASPI’s two-decade Critical Technology Tracker
Dr Jennifer Wong Leung , Stephan Robin & Danielle Cave@ASPI_CTSASPI’s two-decade Critical Technology Tracker: The rewards of long-term research investment
The Critical Technology Tracker is a large data-driven project that now covers 64 critical technologies spanning defence, space, energy, the environment, artificial intelligence, biotechnology, robotics, cyber, computing, advanced materials and key quantum technology areas. It provides a leading indicator of a country’s research performance, strategic intent and potential future science and technology capability.
It first launched 1 March 2023 and underwent a major expansion on 28 August 2024 which took the dataset from five years (previously, 2018–2022) to 21 years (2003–2023). Explore the website and the broader project here.
Governments and organisations interested in supporting this ongoing program of work, including further expansions and the addition of new technologies, can contact: criticaltech@aspi.org.au
Executive Summary
This report accompanies a major update of ASPI’s Critical Technology Tracker website,1 which reveals the countries and institutions—universities, national labs, companies and government agencies—leading scientific and research innovation in critical technologies. It does that by focusing on high-impact research—the top 10% of the most highly cited papers—as a leading indicator of a country’s research performance, strategic intent and potential future science and technology (S&T) capability.Now covering 64 critical technologies and crucial fields spanning defence, space, energy, the environment, artificial intelligence (AI), biotechnology, robotics, cyber, computing, advanced materials and key quantum technology areas, the Tech Tracker’s dataset has been expanded and updated from five years of data (previously, 2018–2022)2 to 21 years of data (2003–2023).3
These new results reveal the stunning shift in research leadership over the past two decades towards large economies in the Indo-Pacific, led by China’s exceptional gains. The US led in 60 of 64 technologies in the five years from 2003 to 2007, but in the most recent five years (2019–2023) is leading in seven. China led in just three of 64 technologies in 2003–20074 but is now the lead country in 57 of 64 technologies in 2019–2023, increasing its lead from our rankings last year (2018–2022), where it was leading in 52 technologies.
India is also emerging as a key centre of global research innovation and excellence, establishing its position as an S&T power. That said, the US, the UK and a range of countries from Europe, Northeast Asia and the Middle East have maintained hard-won strengths in high-impact research in some key technology areas, despite the accelerated efforts of emerging S&T powers.
This report examines short- and long-term trends, to generate unique insights. We have updated the recent five-year results (2019–2023) to show current research performance rankings (top 5 country results are in Appendix 1). We have also analysed our new historical dataset to understand the country and institutional trends in research performance over the full 21-year period. In select technologies we have also made projections, based on current trends, for China and the US to 2030.
The results show the points in time at which countries have gained, lost or are at risk of losing their global edge in scientific research and innovation. The historical data provides a new layer of depth and context, revealing the performance trajectory different countries have taken, where the momentum lies and also where longer term dominance over the full two decades might reflect foundational expertise and capabilities that carry forward even when that leader has been edged out more recently by other countries. The results also help to shed light on the countries, and many of the institutions, from which we’re likely to see future innovations and breakthroughs emerge.
China’s new gains have occurred in quantum sensors, high-performance computing, gravitational sensors, space launch and advanced integrated circuit design and fabrication (semiconductor chip making). The US leads in quantum computing, vaccines and medical countermeasures, nuclear medicine and radiotherapy, small satellites, atomic clocks, genetic engineering and natural language processing.
India now ranks in the top 5 countries for 45 of 64 technologies (an increase from 37 last year) and has displaced the US as the second-ranked country in two new technologies (biological manufacturing and distributed ledgers) to rank second in seven of 64 technologies. Another notable change involves the UK, which has dropped out of the top 5 country rankings in eight technologies, declining from 44 last year to 36 now.
Besides India and the UK, the performance of most secondary S&T research powers (those countries ranked behind China and the US) in the top 5 rankings is largely unchanged: Germany (27), South Korea (24), Italy (15), Iran (8), Japan (8) and Australia (7).
We have continued to measure the risk of countries holding a monopoly in research for some critical technologies, based on the share of high-impact research output and the number of leading institutions the dominant country has. The number of technologies classified as ‘high risk’ has jumped from 14 technologies last year to 24 now. China is the lead country in every one of the technologies newly classified as high risk—putting a total of 24 of 64 technologies at high risk of a Chinese monopoly. Worryingly, the technologies newly classified as high risk includes many with defence applications, such as radar, advanced aircraft engines, drones, swarming and collaborative robots and satellite positioning and navigation.
In terms of institutions, US technology companies, including Google, IBM, Microsoft and Meta, have leading or strong positions in artificial intelligence (AI), quantum and computing technologies. Key government agencies and national labs also perform well, including the National Aeronautics and Space Administration (NASA), which excels in space and satellite technologies. The results also show that the Chinese Academy of Sciences (CAS)—thought to be the world’s largest S&T institution5—is by far the world’s highest performing institution in the Critical Tech Tracker, with a global lead in 31 of 64 technologies (an increase from 29 last year, see more on CAS in the breakout box on page 19).
The results in this report should serve as a reminder to governments around the world that gaining and maintaining scientific and research excellence isn’t a tap that can be turned on and off. Too often, countries have slowed or stopped investing in, for example, research and development (R&D) and manufacturing capability, in areas in which they had a long-term competitive advantage (5G technologies are an example6). In a range of essential sectors, democratic nations risk losing hard-won, long-term advantages in cutting-edge science and research—the crucial ingredient that underpins much of the development and advancement of the world’s most important technologies. There’s also a risk that retreats in some areas could mean that democratic nations aren’t well positioned to take advantage of new and emerging technologies, including those that don’t exist yet.
Meanwhile, the longitudinal results in the Critical Tech Tracker enable us to see how China’s enormous investments and decades of strategic planning are now paying off.7
Building technological capability requires a sustained investment in, and an accumulation of, scientific knowledge, talent and high-performing institutions that can’t be acquired through only short-term or ad hoc investments.8 Reactive policies by new governments and the sugar hit of immediate budget savings must be balanced against the cost of losing the advantage gained from decades of investment and strategic planning. While China continues to extend its lead, it’s important for other states to take stock of their historical, combined and complementary strengths in all key critical technology areas.
This report is made up of several sections. Below you’ll find a summary of the key country and institutional findings followed by an explanation of why tracking historical research performance matters. We then further analyse the nuances of China’s lead and briefly explain our methodology (see Appendix 2 for a detailed methodology). We also look more closely at 10 critical technology areas, including those relevant to AI, semiconductors, defence, energy, biotechnology and communications. Appendix 1 contains visual snapshots of top 5 country rankings in the 64 critical technologies.
We encourage you to visit ASPI’s Critical Technology Tracker website (https://techtracker.aspi.org.au) and explore the new data.
- Joined
- Jul 3, 2024
- Messages
- 795
- Likes
- 374
What is ASPI’s Critical Technology Tracker?
ASPI’s Critical Technology Tracker is a unique dataset that allows users to track 64 technologies that are foundational for our economies, societies, national security, defence, energy production, health and climate security. It focuses on the top 10% of the most highly cited research publications from the past 21 years (2003–2023).9 The new dataset is analysed to generate insights into which countries and institutions—universities, national labs, companies and government agencies—are publishing the greatest share of innovative and high-impact research. We use the top 10% because those publications have a higher impact on the full technology life cycle and are more likely to lead to patents, drive future research innovation and underpin technological breakthroughs.10Critical technologies are current or emerging technologies that have the potential to enhance or threaten our societies, economies and national security. Most are dual- or multi-use and have applications in a wide range of sectors. By focusing early in the science and technology (S&T) life cycle, rather than examining technologies already in existence and fielded, the Critical Technology Tracker doesn’t just provide insights into a country’s research performance, but also its strategic intent and potential future S&T capability. It’s only one piece of the puzzle, of course: it must be acknowledged that actualising and commercialising research performance into major technological gains, no matter how impressive a breakthrough is, can be a difficult, expensive and complicated process. A range of other inputs are needed, such as an efficient manufacturing base and ambitious policy implementation.
The Tech Tracker’s dataset has now been expanded and updated from five years of data (previously, 2018–2022)11 to 21 years of data (2003–2023). This follows previous attempts to benchmark research output across nations by focusing on quality over quantity, key technology areas and individual institutions, as well as short-term, long-term and potential future trends. This update continues ASPI’s investment in creating the highest quality dataset of its kind.12
Both the website and two associated reports (this one included) provide decision-makers with an empirical methodology to inform policy and investment decisions, including decisions on which countries and institutions they partner with and in what technology areas. A list of the 64 technologies, including definitions, is on our website.13 Other parts of this project include:
- the Tech Tracker website: ASPI’s Critical Technology Tracker14 contains an enormous amount of original data analysis. We encourage you to explore these datasets online as you engage with this report. Users can compare countries, regions or groupings (the EU, the Quad, China–Russia etc.) and explore the global flow of research talent for each technology.
- the 2023 report: We encourage readers to explore the original report, ASPI’s Critical Technology Tracker: the global race for future power.15 In addition to analysing last year’s key findings, it outlined why research is vital for S&T advances and it examined China’s S&T vision. The report also made 23 policy recommendations, which remain relevant today.16
- visual snapshots: Readers looking for a summary of the top 5 countries ranked by their past five years of performance in all 64 technologies (see example below) can jump to Appendix 1.
Key findings
Global and country findings
- China’s lead continues to grow: China has strengthened its global research lead in the past year and is currently leading in 57 of 64 critical technologies. This is an increase from 52 technologies last year, and a leap from the 2003–2007 period, when it was leading in just three technologies. Over the past 21 years, China’s rise from a mid-tier position in global research in the late 2000s to mid-2010s into a research and science powerhouse today has been gradual but consistent. It’s been able to convert its research lead into manufacturing17 in some fields such as electric batteries,18 though there are other areas in which China has been slower to convert its strong research performance into actual technology capability (see page 16).
- China significantly strengthened its standing in the middle of the last decade: It was ahead of the US in 28 technology fields (out of the 64) in the years from 2013 to 2017. In other areas, it has only recently nudged ahead in the 2020s, including in high-performance computing, adversarial AI, advanced integrated circuit design and fabrication (semiconductor chip making), autonomous systems operation technology and quantum sensors, reflecting Beijing’s push into AI and computing. It has also reached parity in its annual publication rate in natural language processing.
- The US is losing the strong historical advantage that it has built: Over the 21-year period, the US has been unable to hold its research advantage. In the early to mid-2000s, the US was by far the dominant research power. Its performance between 2003 and 2007 saw it leading in research for 60 out of 64 technologies. Over two decades, however, that research lead has slipped to only seven technologies (in the 2019–2023 ranking). Some notable holdouts include quantum computing and vaccine and medical countermeasures, in which the US still maintains a dominant position.19 The knowledge, expertise and institutional strengths built over decades of investment and pioneering research are likely to continue to benefit the US in the short term, but China is catching up rapidly through an unsurpassed investment in its own S&T areas and top-performing institutions, especially in key defence and energy technology areas.
- China has built up potential monopoly positions in scientific expertise and top performing institutions:20 In the fields in which China overtook the US a decade or more ago, it has tended to build steady and unassailable leads. In advanced materials and manufacturing, for instance, China made big gains from the late 2000s to mid-2010s, such that it now poses a monopoly risk with extremely high concentrations of research expertise and top-performing institutions in fields including advanced composite materials, advanced protection, coatings, smart materials, novel metamaterials, and nanoscale materials and manufacturing. In several key communication fields, notably advanced optical and radiofrequency communication, and undersea wireless communication, China took the lead in the mid-2010s and has built up substantial leads with between three and five times the research output of the US in the past five years, again posing monopoly threats. In comparison, China’s gains have been relatively recent in biotechnology, gene technology and vaccines, enabling it to surpass the US in its annual high-impact publication rate in the second half of the 2010s and into the 2020s in five of the seven biotechnologies covered in the Tech Tracker (see Appendix 1 for a visual summary of all 64 technologies). The biotechnology field in which China poses the most significant monopoly risk is synthetic biology, where it’s publishing nearly five times more high-impact research than the US after taking the lead in 2016. However, the US still leads in nuclear medicine and radiotherapy and maintains a substantial lead in vaccines and medical countermeasures.
- India accelerates: India now ranks in the top 5 countries for 45 of 64 technologies (an increase from 37 last year). This represents enormous gains from 2003–2007, in which India only placed in the top 5 countries for four technologies.21 While India does not yet lead in any of the 64 critical technologies (note that currently only China and the US lead in any technology), it’s a strong performer across a range of technologies, especially in biofuels and high-specification machining processes,making major gains since 2019.
- Despite India’s upwards trajectory, few Indian institutions appear in the top 5 rankings across any period between 2003–2023. By recent performance, only five Indian institutions place within the top 5 across the 64 technologies.22 Given that India currently does well at the national level (top 5 in 45 technologies), this finding suggests that the country’s research and scientific expertise in critical technologies is highly fragmented. That lack of standout institutional performers may be limiting India’s ability to attract foreign research talent and motivate prominent Indian scientists and technologists to stay at, or come back to, Indian institutions. This stands in contrast to a much smaller country such as Singapore, which manages to break into the top 5 country ranking in only two technologies, supercapacitors and novel metamaterials, but is then equally well represented in the top 5 institution rankings by the Nanyang Technological University (top 5 for 3 technologies) and the National University of Singapore (top 5 for 2).
- India seems poised to overtake China in its publication rate in biofuels within the next few years. This is significant and would mark the only technology in which the lead country isn’t the US or China.
- The UK drops: The UK ranks in the top 5 countries for 36 technologies—a decline from 44 technologies in last year’s results. Looking at the 2003 to 2007 snapshot of results, the UK ranked in the top 5 countries for 47 technologies. The technologies in which the UK has fallen out of the top 5 rankings are spread across a range of areas, but are mostly technologies related to advanced materials, sensing and space. For example, the 2003 to 2007 snapshot shows the UK placing 2nd in satellite positioning and navigation and small satellites and 3rd in space launch systems. However, recent performance shows the UK placed 6th, 8th and 9th in these technologies, respectively. There have been some gains as well, particularly in defence related technologies such as electronic warfare and directed energy technologies.
- The European Union, as a whole, is a competitive technological player: With members of the EU aggregated over the past five years, we found that the EU leads in two technologies (gravitational-force sensors and small satellites) and is ranked second in 30 technologies. When counted as a bloc, the EU’s position as the first- or second-ranked ‘country’ can change the technology monopoly riskin those technologies because of its impact on the ratio of the lead country’s research share over that of the second-ranked country as well as the number of institutions.
- As a bloc, the EU’s stronger alignment on building and supporting S&T capability can be seen through programs like Horizon Europe, the EU’s key program that funds research and innovation (worth €93.5 billion in 2021–27),23 and fellowships which encourage and support the mobility of talent such as the European Commission’s Marie Skłodowska-Curie fellowships.24 Many of the top performing European institutions in the Tech Tracker have long benefited (some substantially)25 from these generous funding schemes. Groupings like AUKUS and the Quad (US, Japan, India, and Australia) could learn a lot from such schemes as they increase investment in select critical technology areas.
- Germany is the top-performing European Union country:Germany ranks in the top 5 countries in 27 technologies in recent results, with Italy in the top 5 in 15 technologies, and France lagging behind, ranking in the top 5 in only three technologies.
- Looking historically at 2003–2007, Germany was also the top-performing country in Europe, placing in the top 5 in 45 technologies compared with France (32) and Italy (10).
- South Korea’s performance shows that Japan has work to do: South Korea is in the top 5 for an impressive 24 technologies, mostly in the AI and energy and environment categories, while Japan is reduced to only eight, with strengths in wide and ultrawide bandgap semiconductors and nuclear energy. Looking back to 2003–2007 shows that the two countries, which have similar histories of high-technology industrial strength, have more-or-less inverted in their positions over the two decades, with Japan then ranked in the top 5 countries in 32 technologies compared with South Korea’s seven.
- Iran excels at defence-sensitive technologies: Based on its performance over the past five years, Iran is in the top 5 countries in eight of the 64 technologies and is strong in advanced materials and manufacturing and biotechnologies. Iran ranks 3rd in smart materials and air independent propulsion. Back in 2003–2007, Iran’s best performance was ranking 17th in machine learning.26
- In air-independent propulsion,27 Iran has three of the top 10 institutions: the University of Tehran (5th), Islamic Azad University (7th) and Shahrood University of Technology (9th). In fact, Iran is the only country other than China to have institutions in the top 10 institutions in air-independent propulsion, smart materials and advanced data analytics. Islamic Azad University is the top Iranian institution and makes the top 10 institutions in six other technologies when ranked by recent performance: mesh and infrastructure-independent networks (1st), drones, swarming and collaborative robots (8th), smart materials (7th), advanced data analytics (7th), antibiotics and antivirals (6th) and biofuels (8th).
- Australia has improved in some technologies and slipped in others: Based on recent performance, Australia is in the top 5 countries in seven technologies—a small drop from last year, when it ranked in the top 5 in nine technologies (the losses were in additive manufacturing and advanced protection).
- When comparing Australia’s recent results with those of 2003–2007, Australia has improved its overall ranking by moving up to rank in the top 10 countries in AI and robotic technologies (machine learning, natural language processing, advanced robotics and autonomous systems operation technologies), advanced materials and manufacturing (critical minerals extraction and processing and nanoscale materials and manufacturing), energy and environment (hydrogen and ammonia for power and supercapacitors) and biotechnologies (synthetic biology and genetic engineering).
- But Australia has slipped significantly in all quantum technologies except for quantum sensors, biological manufacturing and in some key defence technologies (autonomous underwater vehicles, satellite positioning and navigation and hypersonic detection and tracking).
- AUKUS—the trilateral security and technology partnership involving the US, the UK and Australia28—closes the gap in some Pillar 2–relevant technologies, but not all: In a few technologies, such as adversarial AI, the combined research efforts of the AUKUS countries place the grouping on par with China (as the lead country). But, in a range of technologies, such as advanced robotics and autonomous systems operation technology, combined AUKUS efforts still trail China’s high-impact research output (see Figure 1 below).
- Combining AUKUS efforts with those of closer partners Japan and South Korea in these areas however helps close the gap in research performance. In some technologies, such as autonomous underwater vehicles and hypersonic detecting and tracking, China’s high-impact research lead is so pronounced that no combination of other countries can currently match it.
- However, for all countries, it’s important to note that research underpinning the development of defence-related technologies can be considered sensitive and is among the most likely to shift into classified and commercial-in-confidence labs and projects. As the US has peaked earlier than China in those research areas, for example, it’s possible that, in some sensitive technology areas, there has been a movement of some research into classified or commercial-in-confidence spaces that has occurred after some of those peaks (for more discussion on this see pages 15-18). Notwithstanding that caveat, countries should avoid complacency, given that China, and all countries, are likely to do the same.
Data source: ASPI Critical Technology Tracker
Technology monopoly risk metric results
- Scientific breakthroughs and research innovations in key defence technologies are increasingly likely to occur in China: Our technology monopoly risk metric—which show where there have been high concentrations of scientific expertise and high-impact research output in a single country within the past five years—reveals that various technologies with clear military and national-security applications have now changed from medium to high.29 The new critical technologies now classified as ‘high-risk’ include radar, satellite positioning and navigation, advanced aircraft engines, and drones, swarming and collaborative robots. They join hypersonic detection and tracking and electronic warfare.
- China’s research lead in advanced materials and manufacturing technologies grows: China has steadily increased its research dominance in advanced materials and manufacturing—a category in which it already had a substantial lead.30 Three additional technologies (high-specification machining processes, novel metamaterials and smart materials) have now increased from medium to high risk (see Appendix 1). Advanced protection has increased from low to high risk, while two other technologies (advanced magnets and superconductors and continuous-flow chemical synthesis) have increased from low to medium risk.
Institutional findings: US tech companies, government agencies and CAS
- Private-sector research is increasingly concentrated in US technology giants: Looking at high-impact research conducted between 2019 and 2023, we see research excellence consolidating within a few US technology giants. IBM now ranks 1st in quantum computing, Google ranks 1st in natural language processing and 4th in quantum computing, and Meta and Microsoft also place 7th and 8th in natural language processing respectively. The only non-US based companies that rank in the top 20 institutions for any technology are the UK division of Toshiba, which places 13th in quantum communications, and Taiwan Semiconductor Manufacturing Company Limited (TSMC), which place 20th in advanced integrated circuit design and fabrication.
- Private sector research was more diverse between 2003-2007: When we look back at results from the 2003–2007 snapshot, there were a range of companies from around the world that ranked in the top 20 institutions. To name a few, IBM (US) ranked 1st in high-performance computing, Philips (Netherlands) ranked 3rd in advanced integrated circuit design and fabrication, Samsung (South Korea) ranked 5th in advanced radiofrequency communications, Microsoft (US) tied for 6th in natural language processing, Nokia31 (US) and Nippon Telegraph and Telephone (NTT, Japan) ranked 4th and 7th respectively in advanced optical communications, Reaction Engines Limited (UK) ranked 3rd in space launch systems, and Merck (US) ranked 8th in novel antibiotics and antivirals research. Also placing in the top 20 rankings in different critical technology areas were Texas Instruments, Siemens and General Electric.
- The Chinese Academy of Sciences (CAS) is the global science and research powerhouse: CAS, which is thought to be the world’s largest research institute, is the top-performing institution in the Critical Technology Tracker. With approximately 113 institutes, its sheer size propels it into a dominant position.32 For research conducted in the past five years, CAS leads, against all other institutions, in 31 of 64 technologies—a major increase from 2003–2007, when CAS was leading in only six technologies. CAS currently excels in energy and environment technologies, advanced materials (including critical minerals extraction and processing) and in a range of quantum, defence and AI technologies, including advanced data analytics, machine learning, quantum sensors, advanced robotics and small satellites (see page 19 for more on CAS).
- Government agencies and national laboratories feature prominently: A range of government-affiliated research organisations appear throughout the 2019–2023 rankings. In particular, NASA ranks 1st in space launch systems and 3rd in small satellites, and the US’s National Institute of Standards and Technology ranks 2nd in atomic clocks. After CAS (discussed above), the government-affiliated organisation that ranks strongly across the most technologies is the Helmholtz Association of German Research Centres, which ranks 2nd in space launch systems, 3rd in satellite positioning and navigation, 4th in advanced magnets and superconductors and 5th in gravitational sensors.33
- However, the presence of government agencies and labs has dropped over the 21-year period. There were many more in the 2003–2007 data, and they were leading in more technologies. For example, in 2003–2007 the French National Centre for Scientific Research led in advanced magnets and superconductors, small satellites and supercapacitors, India’s Council of Scientific and Industrial Research led in biological manufacturing, and the US’s Agricultural Research Service led in biofuels. The direct involvement of government-affiliated research organisations is especially evident in technologies with strong defence applications such as advanced explosives and energetic materials, where each of the top 3 institutions were government-affiliated: the Los Alamos National Laboratory (US), the Defence Research and Development Organisation (India) and the Russian Academy of Sciences. Our results show that a similar concentration of government-linked research institutes was leading in advanced aircraft engines in 2003–2007.
- Chinese companies play a relatively small role in the global research ecosystem: Despite their very strong performance in a wide range of technologies at the national level, Chinese companies still lag in their rankings for high-impact research. For example, in advanced aircraft engines, a technology for which China published around 70% of total global high-impact research in 2023, the top-performing company is the Aero Engine Corporation of China (founded in 2016), which on recent performance ranks 22nd. Similarly, in advanced radiofrequency communication, in which China was responsible for 30% of global high-impact research in 2023, Huawei Technologies, as the top-performing Chinese company, ranks only 58th by recent performance and is completely absent when ranked by performance between 2003 and 2007. While for all countries it’s research-dedicated institutions that lead most of the rankings in the Tech Tracker, it’s surprising that Chinese companies aren’t higher up and closer to their US counterparts, many of which rank highly.
- Joined
- Jul 3, 2024
- Messages
- 1,721
- Likes
- 2,293
you are denying a reality, no nation in 2024 makes everything domestic.I'm not going to say that your statement is wrong.
But yours is a favorite theory in the developed West,
“If you fly embraer you fly a brazilian airplane with parts made all over the world, if you use a nokya or samsung telephone is the same.”
This actually confuses the difference between core technology and general technology, core parts and general parts.
“All civilizations are sharing, manufacture is the same.”
Rich and poor countries disagree
Companies are transnationals, they work with research centers in many places and manufacture in many places, what is happening you are focus in China and have no idea what is happening else where.
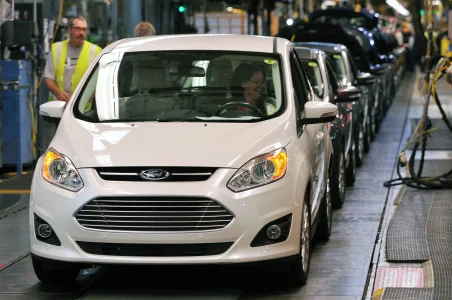
Do american companies care about american workers? no they do not they care about their profits.
Since 2014, engineers at Ford Mexico have registered 252 patents with the Mexican Institute of Industrial Property (IMPI), contributing 62.8% of the company's total of 401 patents worldwide. This achievement makes Mexico the second-largest region for Ford's patent registrations, following the United States.

Ford Mexico Engineers Register 62.8% of Global Total Patents
Ford Mexico engineers have registered 252 patents, representing 62.8% of the global total
Four Mexican-Made Patents that Would Make Henry Ford Proud
With the opening of the new Global Technology & Business Center (GTBC), it’s a great time to highlight some of the recent patents from Ford of Mexico’s National Engineering Center. Ford of Mexico keeps Henry Ford's legacy of innovation alive by solving problems in creative ways that help us improve
"GEIQ is one of the most important engineering and technological design complexes in Mexico, dedicated to the design of turbo machinery and energy generation systems. It employs almost 1,700 engineers," the governor said.
In addition, the center has generated two 100% Mexican-made patents and around 24 patent applications.

GE to expand its operations in Queretaro - MEXICONOW
General Electric Aerospace announced the expansion of the company's research and development operations at its Advanced Engineering Center
Aerolab was contracted to design and build the Honeywell Aerospace testing facilities in Mexicali, Baja California.
The facility includes an open jet wind tunnel to support the 777X platform by Boeing, enabling the development of the engineering capacities in Honeywell Mexicali over the next two years.
The tunnel uses a 3000HP centrifugal blower capable of producing speeds up to 230 miles per hour. This Honeywell wind tunnel is the largest wind tunnel in Latin America and the only one in Mexico dedicated to the aerospace industry. The company invested US$ 15 million toward the new site.

Honeywell Aerospace - Aerolab
Aerolab was contracted to design and build the Honeywell Aerospace testing facilities in Mexicali, Baja California. The facility includes an open jet wind tunnel to support the 777X platform by Boeing, enabling the development of the engineering capacities in Honeywell Mexicali over the next two...
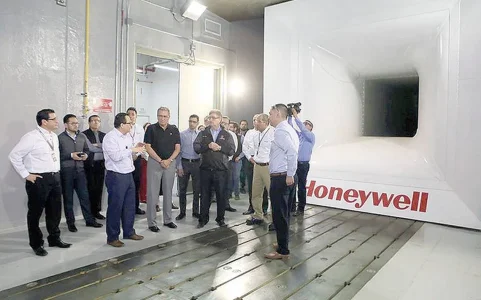
The reality this is globalization, mexicans design for USA companies but the patent is for the company, it does not matter is a Mexican, Indian Chinese, French, Arab or African, it matters only the profit.
cruel reality
- Joined
- Jul 3, 2024
- Messages
- 795
- Likes
- 374
you are denying a reality, no nation in 2024 makes everything domestic.
Yes, not all parts are important.
Developed countries pay attention to core technology, core components.
- Joined
- Jun 30, 2024
- Messages
- 3,568
- Likes
- 30,754
- Joined
- Jul 3, 2024
- Messages
- 1,721
- Likes
- 2,293
your concept is not true, in business is trust and profitability.Yes, not all parts are important.
Developed countries pay attention to core technology, core components.
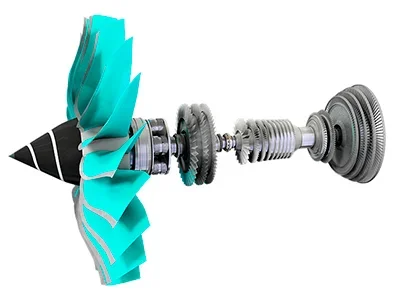
ITP makes the fan of Trent engines tell me is the fan core technology?
The answer is R&R trusts ITP, same Safran Trusts GE.
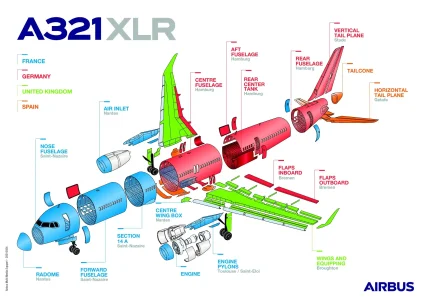
Core Technologies do not exist, ASML is a dutch company but american companies paid for it shared technology, when a company is competition you have core technogies when a company share profits no core technologies exist since sharing technology improves technology and Airbus safran GE share but COMAC or UAC do not share then core technologies exist
Answer China copies and steals


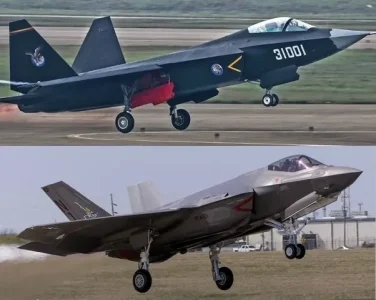
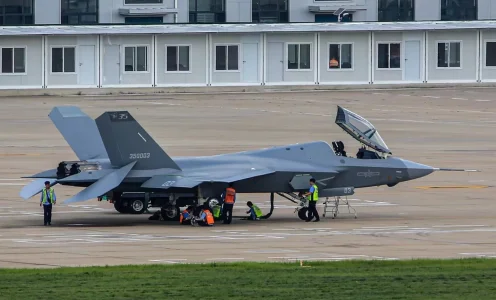
When some one copies and steals then core technology exists
Last edited:
- Joined
- Jul 3, 2024
- Messages
- 1,721
- Likes
- 2,293
Yes, not all parts are important.
Developed countries pay attention to core technology, core components.

shared core technologies
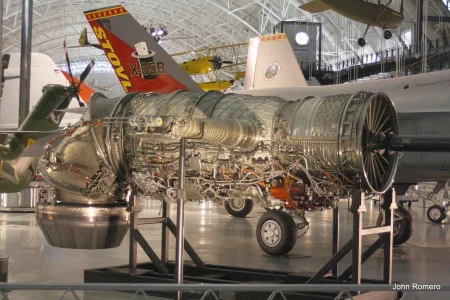
Finnish defence company, Patria, and Pratt & Whitney have signed an agreement for F135 engine production and sustainment projects in Finland by Patria.
The agreement covers the assembly of Pratt & Whitney F135 engines and components by Patria between 2025-2030, followed by a transition to F135 engine Maintenance, Repair, Overhaul and Upgrade (MRO&U) operations, beginning in 2030.
The needed assembly and maintenance lines will be built in Linnavuori, Nokia in Finland. The direct employment impact of this agreement for Patria during this timeframe is estimated to be approximately 50.

F-35 engines to be manufactured in Finland following new agreement
Finnish defence company, Patria, and Pratt & Whitney have signed an agreement for F135 engine production and sustainment projects in Finland by Patria.

GE and Rolls-Royce Propose Fixed Price Offer for F-35 Joint Strike Fighter Engine to Significantly Drive Down Costs Offer to create and accelerate engine competition & change procurement process | GE Aerospace News
EVENDALE, Ohio -- General Electric Co. and Rolls-Royce today announced that they have offered to the Pentagon a fixed price offer on their F136 engine for the Joint Strike Fighter
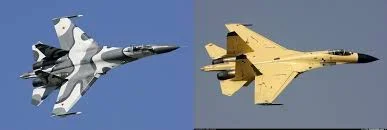
Since China stole Su-27 no shared technologies
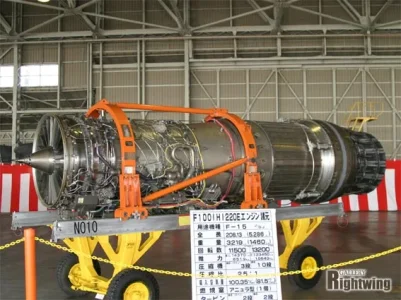
shared technologies
- Joined
- Jun 30, 2024
- Messages
- 3,568
- Likes
- 30,754
- Joined
- Jul 3, 2024
- Messages
- 795
- Likes
- 374
What a beautiful fighter
- Joined
- Jun 30, 2024
- Messages
- 3,568
- Likes
- 30,754
- Joined
- Jul 1, 2024
- Messages
- 4,798
- Likes
- 25,204
Seems like the debt induced growth strategy is starting to show cracks.
The concept of debt works when you can borrow against the future. Debt doesn't work if the future looks bleak because of population decline. So the strategy that worked for the last 4 decades will no longer work for China. What is the new strategy?
The concept of debt works when you can borrow against the future. Debt doesn't work if the future looks bleak because of population decline. So the strategy that worked for the last 4 decades will no longer work for China. What is the new strategy?
Users who are viewing this thread
Total: 3 (members: 1, guests: 2)
Latest Replies
-
Modernisation of Indian Army Infantry
- Unknowncommando
-
Indian Special Forces
- Unknowncommando
-
Dassault Rafale in Indian Air Force
- Unknowncommando
-
Operation Sindoor & Aftermath
- snakeeyes07
-
Indian Air Force's MiG-29UPG
- Unknowncommando
-
Indian Small Arms & Weapons
- Unknowncommando
-
Indian Army Armoured Corps
- Unknowncommando
-
Camouflages & Uniforms of the Indian Armed Forces.
- Unknowncommando
-
Indian Economy
- bakofbakchod
-
Chinese Economy Watch
- helin
